This is a very common question. Most Boards want to know how their Reserves are doing, and, more specifically, how their Reserves are doing “compared to other associations”. Each association requires a different amount of Reserves to perform the anticipated Reserve projects on time, without requiring outside assistance (i.e., special assessments or loans). That’s why making comparisons on the basis of Reserve Fund “size” is a meaningless exercise. Fortunately, there is a straightforward and meaningful way of comparing.
An association’s Reserve Fund “strength” can be measured, and compared to other associations. If an association’s actual Reserves on hand are compared to its current Reserve requirements, a relative measuring scale called Percent Funded is established. Just as we find clothes which “fit” us based on our own particular measurements, this relative measuring scale allows us to measure how well an association’s Reserve fund “fits”, and meets, its Reserve needs. Thus we can confidently measure strength (a good fit) or weakness (a poor fit) of the Reserve Fund, independent of the size of the Reserve Fund.
An association’s Reserve requirement is a computed figure based on the Useful Life, Remaining Useful Life, and Current Replacement Cost of each component. For each component, you multiply the current cost by its fraction of life “used up”. The result of this computation for all Reserve components is summed for an association total, called the Fully Funded Balance (FFB).
To provide a measure of your Reserve Fund “strength”, you then calculate the ratio of your current Reserve Balance to your Fully Funded balance, expressed as a percentage. It doesn’t matter if you have $73,251 in Reserves and another association has $1,159,111. What matters is your Percent Funded. If your Reserve fund is 73% funded and another association’s Reserve fund is 52% funded, your Reserves are in better shape than theirs, even though they might have more Reserve funds on hand.
The Percent Funded graph below is based on a compilation of thousands of our association clients and will show you how the Strength (not the size) of your Reserve Fund compares across the nation:
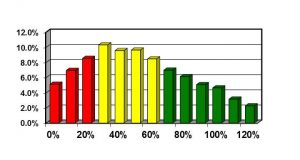
Notice how many associations are in the “strong” (70% funded or higher) green zone. The majority of associations are in the “fair” (30-70% funded) yellow zone, and an expected fraction are in the “weak” (0-30% funded) red zone.
Comparing Reserve Fund Strength using the measure of Percent Funded is a valid and useful exercise. This graph clearly shows that it would be wrong to assume that no association could ever afford to be well funded, because in truth many are.